
Real-time stock monitoring describes systems that continuously record where individual items and aggregate inventory levels are located and how they change. Such systems combine unique identifiers on items, data-capture hardware, local or cloud data processing, and user interfaces so teams can view current quantities across warehouses, stores, and transit. In practical terms this means events—receipts, picks, transfers, returns—are captured promptly and converted into updated records that reflect available stock for operational use. The description here focuses on the technical and process aspects of these monitoring flows rather than recommending specific purchases or providers.
Key technical layers in these systems typically include item identification, automated capture, network transmission, middleware or platform processing, and reporting. Identification may use printed barcodes or radio-frequency tags; capture can be performed by handheld scanners, fixed readers, or smartphone apps; transmission often relies on local Wi‑Fi or cellular networks to cloud services; and software reconciles events against master data. In U.S. logistics and retail environments these components are often integrated with point-of-sale systems, warehouse management systems, and transport management platforms to maintain synchronized counts across multiple locations.
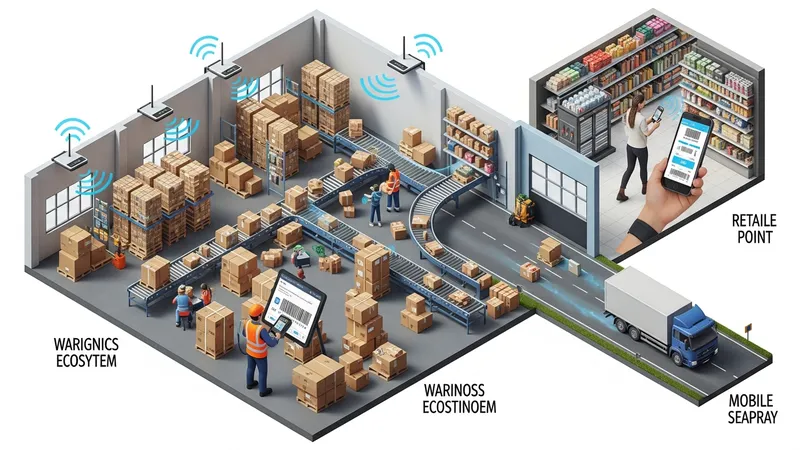
Comparisons among these approaches typically center on read frequency, environmental suitability, and cost per transaction. Barcode scanning is broadly adopted at retail points of sale and in many warehouses because of low unit costs and mature tooling, though it often requires human action to scan each item. RFID can enable higher read throughput and hands-free inventory counts, which may suit distribution centers and high-volume retail backrooms but introduces tag and infrastructure costs and may require careful site surveying for reliable reads. Cloud platforms can centralize visibility across locations but depend on consistent network connectivity and well-defined integration strategies with local hardware.
Data capture and event processing workflows often follow a pattern: capture at the edge, local buffering for intermittent connectivity, transmission to middleware, and reconciliation against master inventory records. In U.S. deployments, teams commonly implement local buffering in handheld devices or gateway appliances to avoid data loss during temporary network outages. Middleware can apply business rules—such as lot or serial number tracking, location hierarchy, and reservation logic—before updating the canonical inventory record. Accurate time-stamping and source identifiers are important for auditability and downstream analytics.
Reporting and analytics functions in these systems may provide real-time dashboards, alerts for low stock thresholds, and historical reports used for forecasting and replenishment planning. In U.S. retail and distribution contexts, visibility often supports same-day fulfillment decisions, cross-dock activities, and replenishment cadence adjustments. Data integrity practices such as periodic cycle counts, reconciliation between receiving manifests and system records, and usage of immutable event logs may be used to maintain trust in the real-time view without implying any guaranteed outcomes.
Integration patterns commonly involve APIs, message queues, and middleware connectors that bridge hardware vendors and cloud platforms. U.S. enterprises may use RESTful APIs, MQTT, or cloud provider messaging services to push capture events into inventory services. Considerations here include payload formats (for example, GS1 EPCIS for RFID event capture), handling duplicate events, and mapping location identifiers to corporate site hierarchies. These integration choices typically influence latency, scalability, and the effort required for ongoing maintenance rather than promising fixed performance levels.
In summary, continuous stock monitoring relies on a coordinated set of identifiers, capture devices, connectivity, and platform processing to present current inventory views across sites. Practical deployments in the United States vary by volume, SKU complexity, and operational priorities, and may blend barcode, RFID, and cloud tools to address specific workflows. The next sections examine practical components and considerations in more detail.
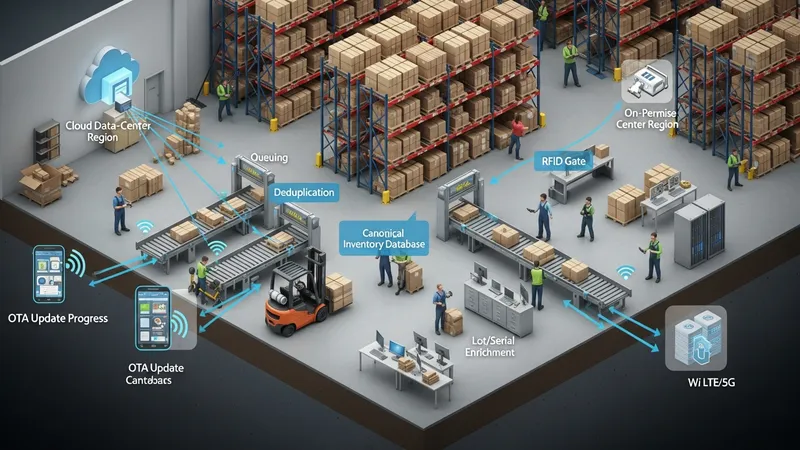
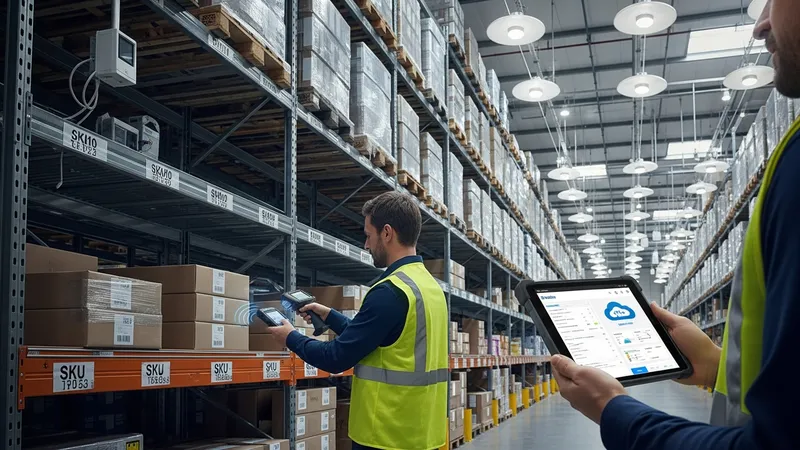
The architecture of modern inventory tracking implementations often distinguishes edge capture hardware from processing and storage layers. Edge devices include handheld barcode scanners, RFID readers, fixed cameras, and mobile devices used by staff. In U.S. warehouses, common practice is to harden devices for industrial environments and to use device management tools to apply updates. Processing layers may run in private data centers or public cloud regions located in the United States; they provide queuing, deduplication, enrichment (for lot and serial handling), and the canonical inventory database. Decisions about on-premise versus cloud processing typically balance latency, regulatory requirements, and integration complexity.
Network connectivity is a critical component that may influence perceived “real-time” freshness of data. In U.S. retail stores and distribution centers, Wi‑Fi is frequently used for handheld scanners and fixed readers; cellular LTE/5G can be used for mobile sites or vehicles. Where connectivity is intermittent, devices often buffer events locally and sync when connections resume. System designers often include health monitoring for readers and gateways to detect offline hardware early; these monitoring streams can be routed to operational dashboards used by facilities teams rather than serving as prescriptive directives.
Middleware and integration layers translate raw capture events into inventory transactions. Common patterns in U.S. implementations use message brokers and microservices to accept varying input formats, normalize SKU and location identifiers, and apply business rules such as reservations or allocations. Mapping of third-party identifiers to internal product master records is frequently required when integrating suppliers or partners. These mapping tasks often require a governance process to reduce mismatches and may be supported by master data management tools.
Storage and retrieval choices affect how quickly users can obtain aggregated views and historical traces. Cloud-native databases and time-series stores are often used for event logs in U.S. deployments, enabling queries for recent transactions and for auditing. Data retention policies—how long raw events are kept—may reflect operational needs and compliance or cost trade-offs. Designing storage for both current-state queries and occasional deep forensic analysis tends to be a practical consideration rather than an absolute technical requirement.
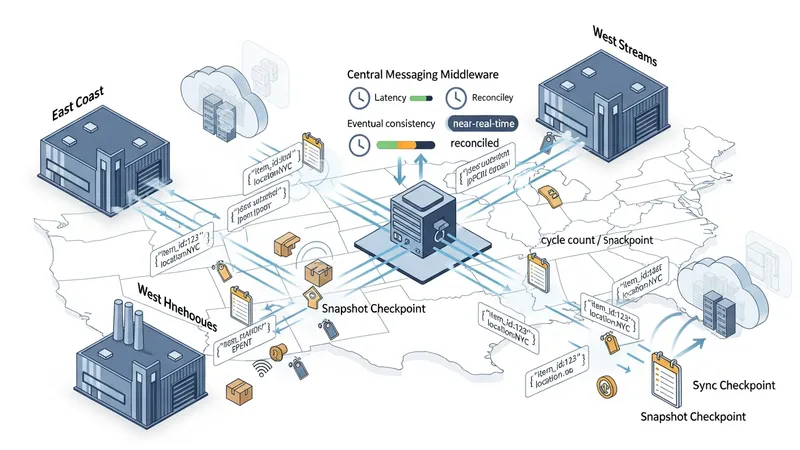
Maintaining synchronized inventory across multiple locations typically involves patterns that reconcile event-driven updates with periodic full-state checks. In U.S. supply chains, systems may use event streams to reflect immediate changes while scheduled inventory snapshots or cycle counts provide correction points. Eventual consistency models are common: systems may present a near-real-time view that is typically accurate for operational decisions but might be reconciled later against definitive records. Architecture choices such as whether to use push or pull synchronization, the chosen messaging middleware, and the format of events (for example, JSON or EPCIS) influence latency and operational complexity.
Cloud providers with U.S. regions are often used to host inventory services because they offer managed storage, messaging, and analytics tools that can scale with peak demand. When architecting in this environment, teams typically plan for multi-region redundancy to meet availability expectations and to reduce latency for geographically dispersed users. Data sovereignty and contractual requirements within the United States can influence whether data is stored in a single region or replicated. Such design choices affect recoverability and the operational overhead for maintaining synchronized copies.
API design and versioning are important in multi-vendor environments where scanners, WMS, POS, and carrier systems all exchange inventory-related messages. In U.S. integrations, it is common to expose RESTful APIs for transactional updates and webhooks for event notifications, while message queues may be used for larger-scale event streams. Considerations often include idempotency handling, rate-limiting, and schema evolution approaches that allow vendors to update clients without disrupting operations. Planning for backward compatibility and clear schema contracts is typically emphasized to reduce integration churn.
Latency targets are usually set according to business requirements: store replenishment and online order fulfillment often require second-to-minute freshness, while accounting systems may tolerate longer delays. In U.S. retail chains, systems frequently separate the operational, near-real-time inventory view used for fulfillment from the financial inventory view used for reporting and cost accounting. This separation allows operational systems to prioritize fast updates while periodic reconciliations ensure alignment with ledgers and regulatory reporting. These design trade-offs are framed as considerations rather than prescriptive mandates.
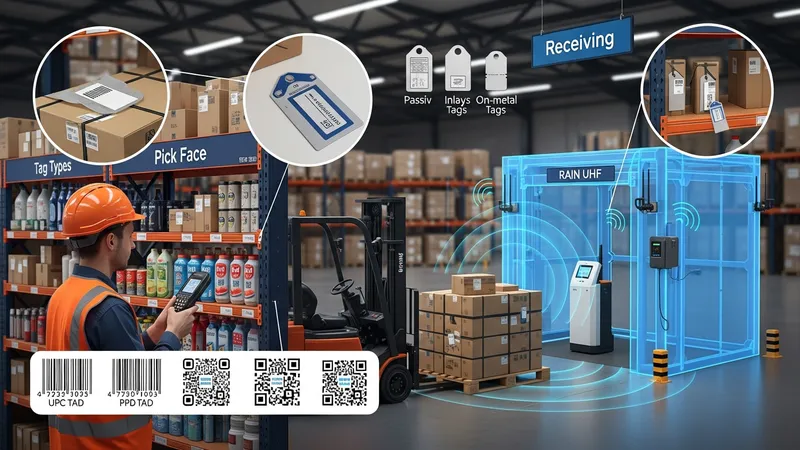
Barcodes remain the most widely used identification method in U.S. retail and many distribution settings because they are low-cost and supported by mature scanning ecosystems. 1D barcodes (UPC) and 2D codes (QR, DataMatrix) are common on consumer goods and on pick faces. Barcode scanning generally requires line-of-sight and a deliberate scan action by staff, which can limit throughput in high-volume contexts but provides straightforward traceability for unit-level movements. Maintenance considerations include label durability, print quality, and periodic verification of code readability during receiving and replenishment tasks.
RFID offers advantages where non-line-of-sight reads and batch processing are valuable, such as rapid store-level inventory counts or pallet-level tracking in warehouses. U.S. deployments often adopt RAIN RFID for passive UHF use, following EPC standards for item-level event reporting. Practical considerations include tag selection (on-metal, embedded, or inlays), reader placement to avoid dead zones, and site surveys to model tag read performance. Tagging strategies—polybagging, case-level, or item-level—affect both accuracy and cost and are frequently piloted to establish return-on-effort expectations rather than assuming uniform outcomes.
>
Reader and antenna placement, power settings, and environmental factors (metal shelving, liquids) can substantially influence RFID reliability in U.S. facilities. Site surveys and phased rollouts are commonly recommended to identify interference patterns and to refine read zones for receiving docks and conveyor lines. Barcode systems may require different physical workflows, such as scan tunnels or fixed reading points, to achieve higher throughput. Choosing between barcode and RFID methods typically depends on throughput needs, SKU unit economics, and the operational benefits expected from automation.
Hybrid approaches—using barcodes for certain flows and RFID where it is cost-effective—are common in the United States. For example, a retailer might use barcodes for low-cost items while tagging apparel with RFID to support rapid store-level inventory counts. Integration of both data streams into a single inventory platform requires mapping event types to consistent inventory transactions and maintaining a product master that references both barcode and EPC identifiers. These integration and master-data considerations often drive pilot scope and the pace of broader rollouts rather than representing fixed deployment rules.
Cost elements for real-time monitoring systems typically include hardware, software subscriptions or licenses, integration services, and ongoing operational expenses such as tag replenishment and device maintenance. In the United States, hardware procurement for scanners and readers often represents an upfront capital expense, while cloud platform subscriptions and support are recurring costs. Teams frequently model total cost of ownership over multiple years when evaluating approaches, accounting for device refresh cycles, tag consumable rates, and staff time for configuration and audits. These modeling activities are used to inform decisions rather than to promise specific financial outcomes.
Implementation timelines and resource allocations often depend on SKU complexity, number of locations, and existing system maturity. U.S. organizations commonly run pilot projects in a single distribution center or a small cluster of stores to assess read performance, workflow impact, and integration complexity. Lessons from pilots often shape inventory-tagging rules, allocation of fixed reader infrastructure, and the degree of automation in receiving and picking processes. Planning for change management and training is frequently cited as a practical consideration to support consistent scanning behavior by staff.
Operational governance practices help sustain data quality: scheduled cycle counts, reconciliation workflows, exception-handling rules, and periodic audits of physical versus system records. In U.S. retail operations, regular shelf audits and point-of-sale reconciliation are used to detect drift between the real-time system view and physical stock levels. Establishing clear escalation paths for discrepancies, defining who owns master data updates, and instrumenting dashboards for inventory health metrics are common practices to maintain long-term reliability.
Scalability and vendor support models are additional considerations. U.S. deployments that scale across many stores or large distribution networks often require vendor SLAs for hardware replacement, software uptime, and integration support. Decisions about in-house versus vendor-led operations typically hinge on internal capabilities and the strategic importance of inventory visibility. These operational and contractual choices are framed as factors to evaluate; they are not presented here as prescriptive directives or guarantees of specific performance outcomes.